This is a brief collection of my first experience with Python and Tableau. The data was processed by Python and visualized by Tableau per company's request.


***In order to maintain the secrecy of company, all names and indicators have either been blurred or completely covered by rectangular boxes. These are a few of a myriad of analysis I was able to share without sacrificing my clients' privacy.
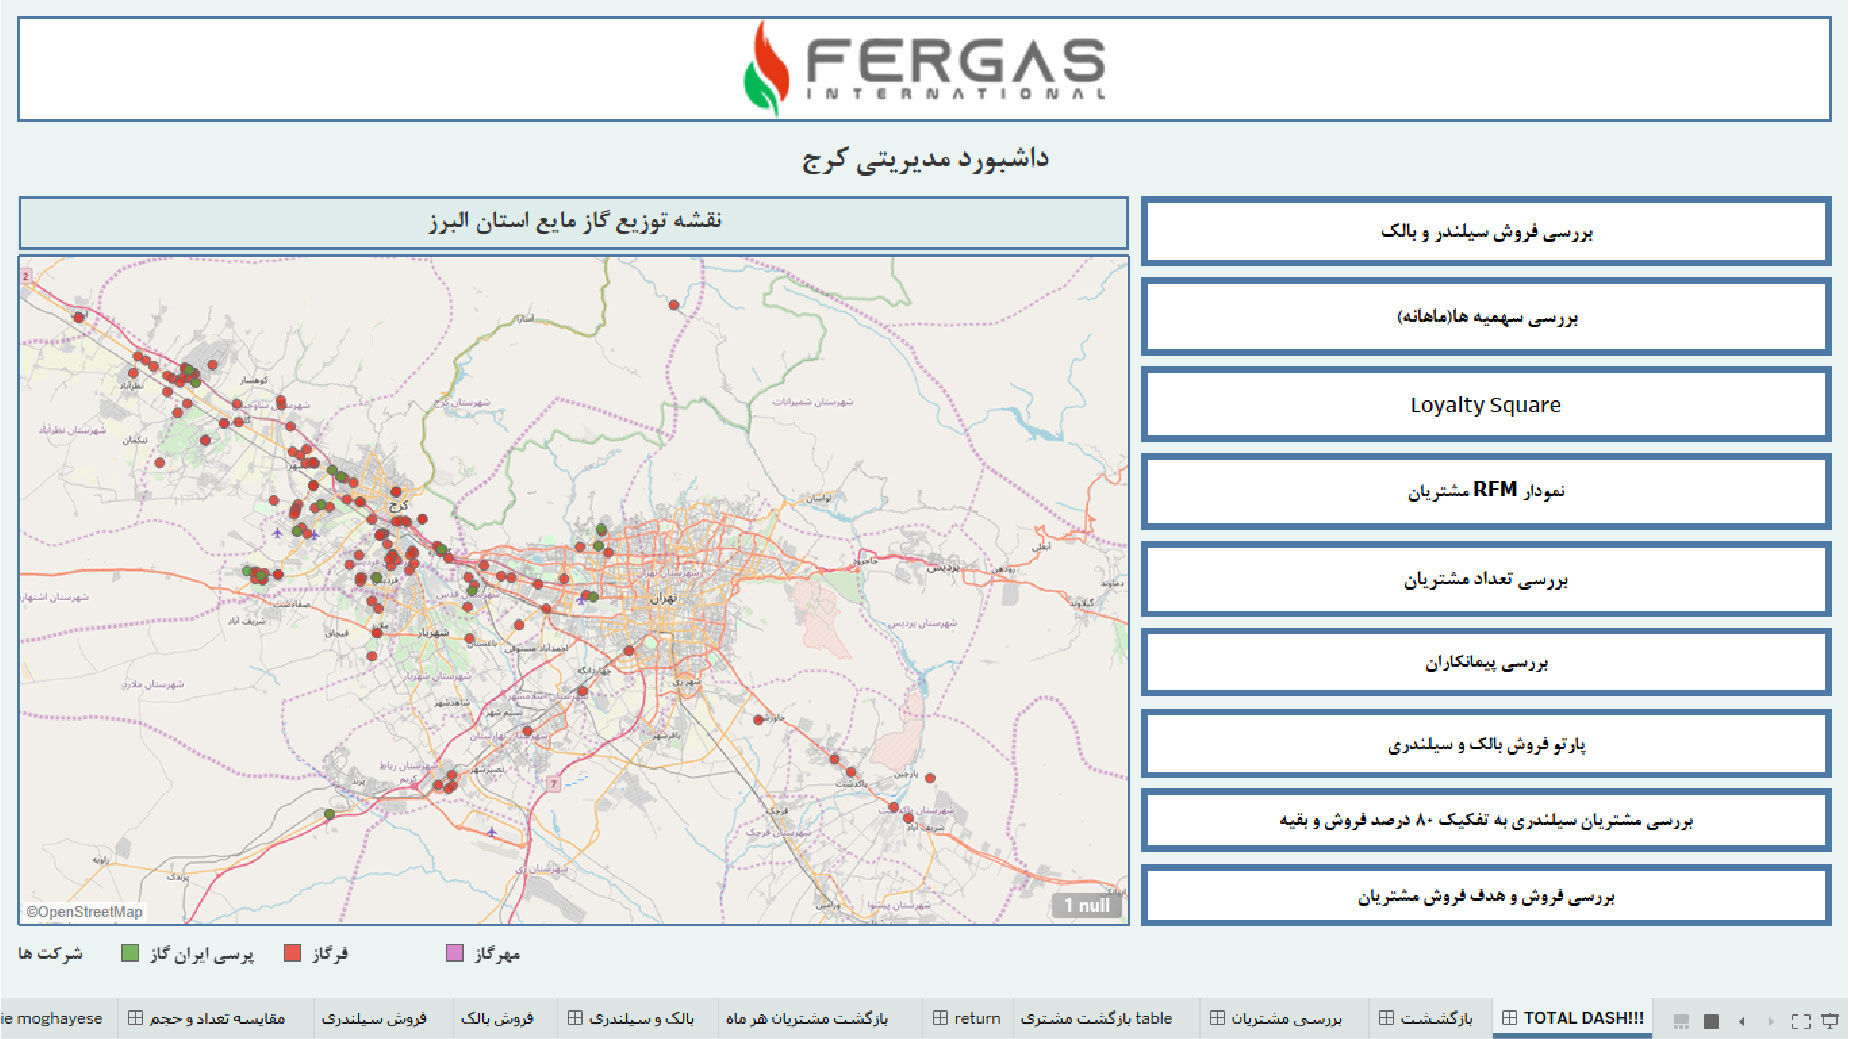
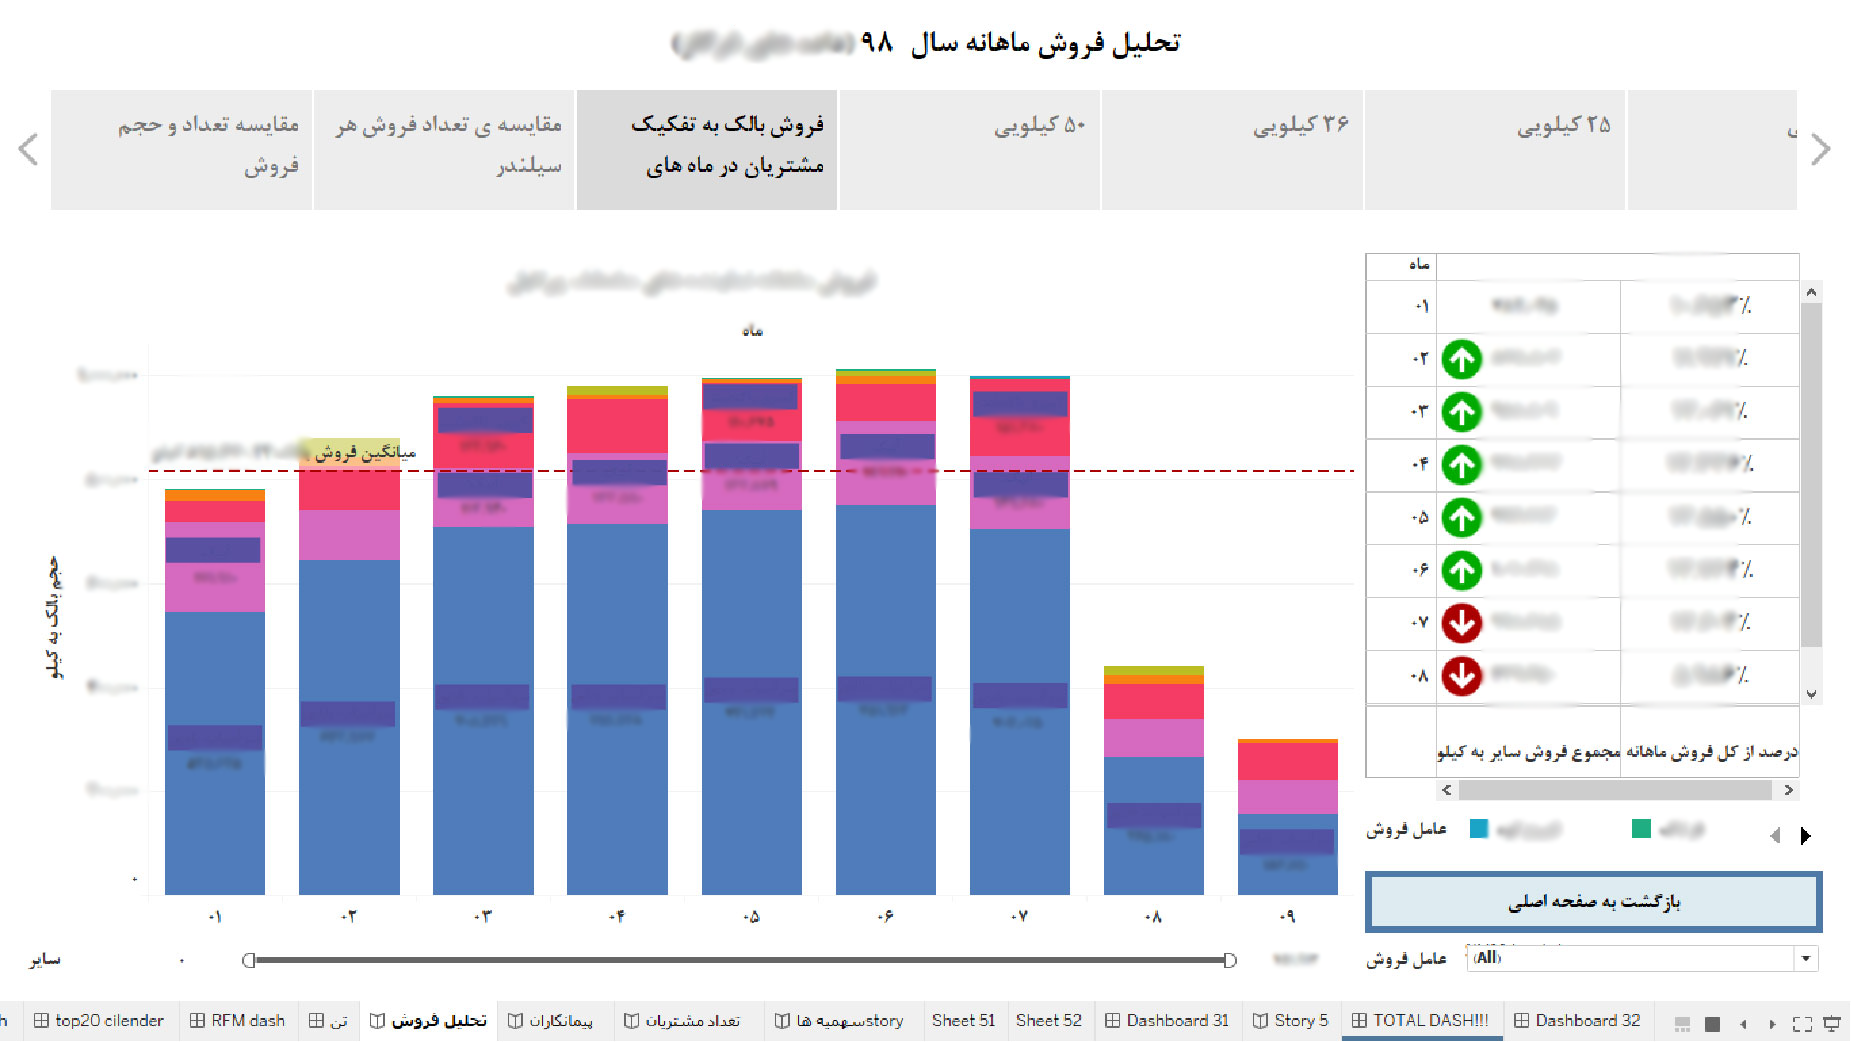
Figure 1. Preface of one of the dashboards

Figure 3. Demand fluctuations of a specific product

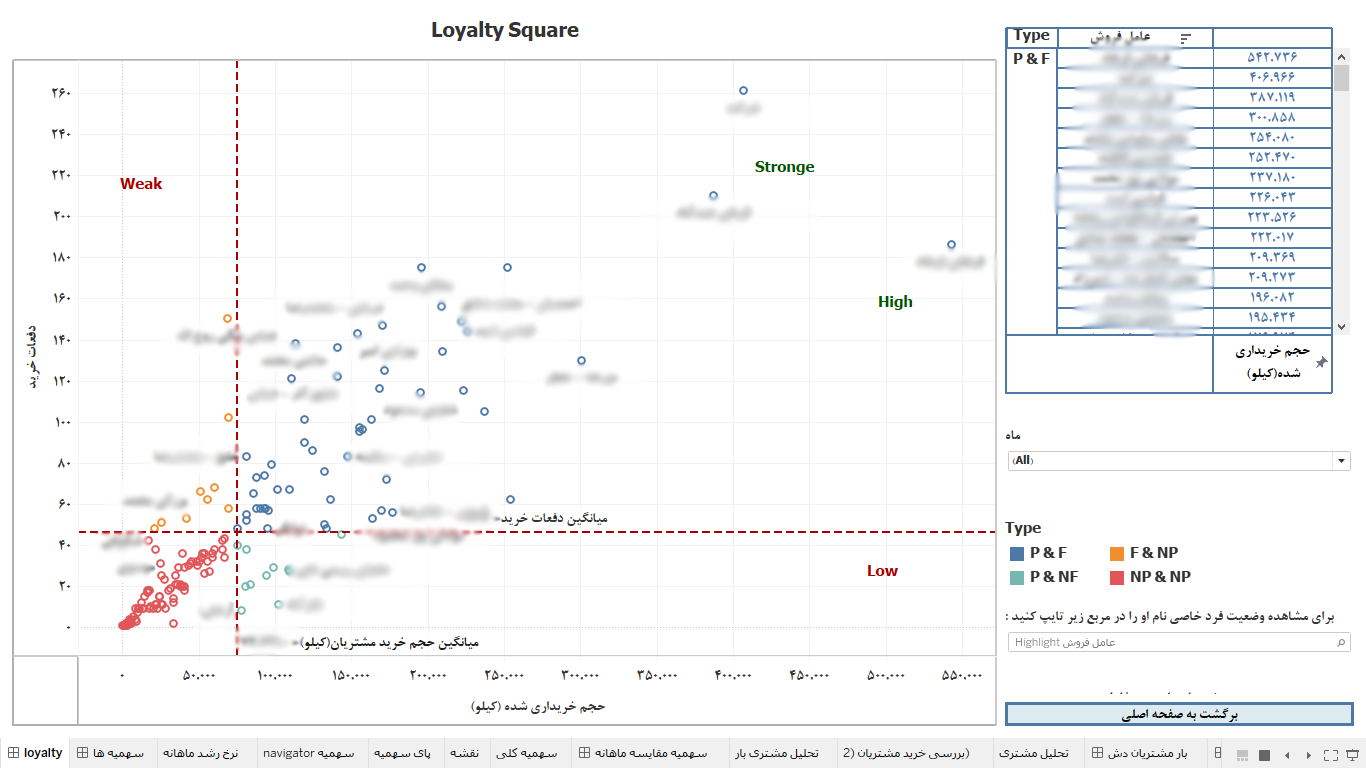
Figure 4. A simple categorization of Customers

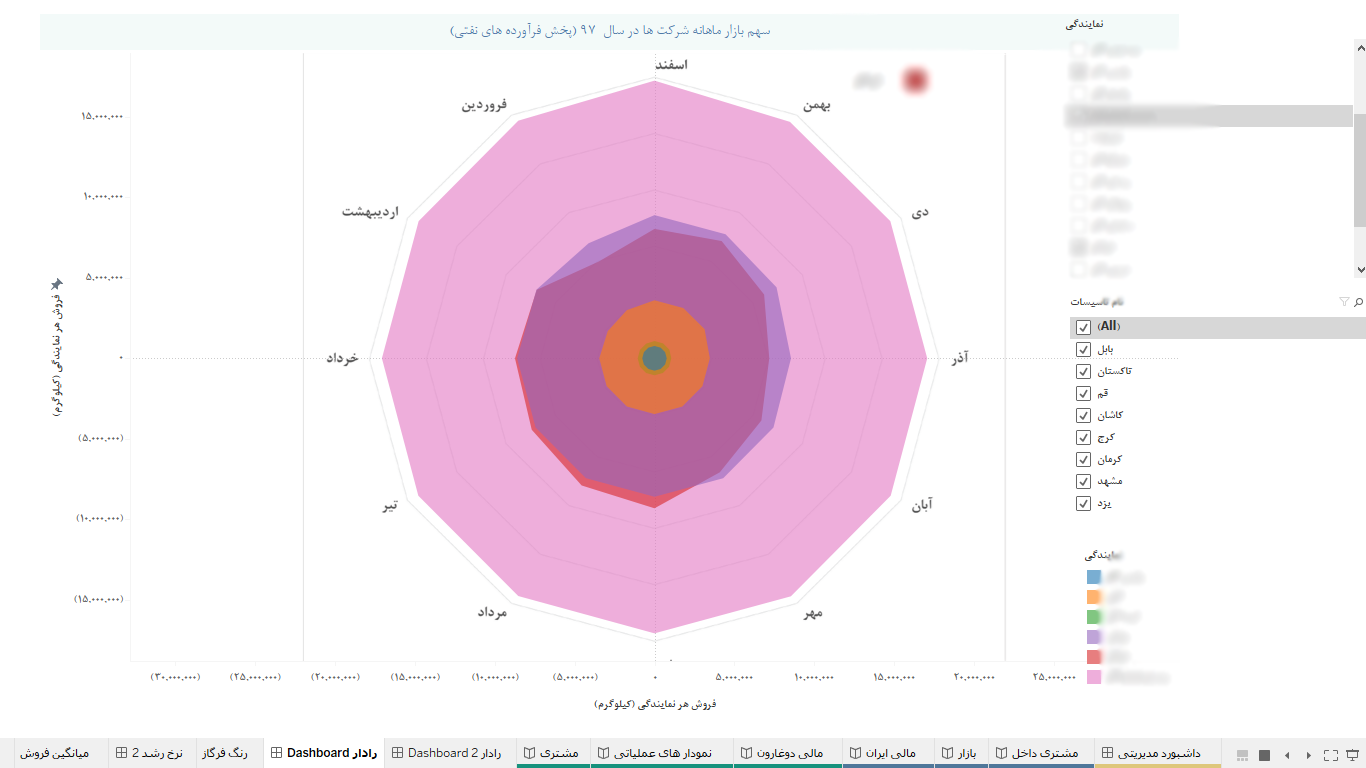
Figure 5. Comparison of companies performance by months

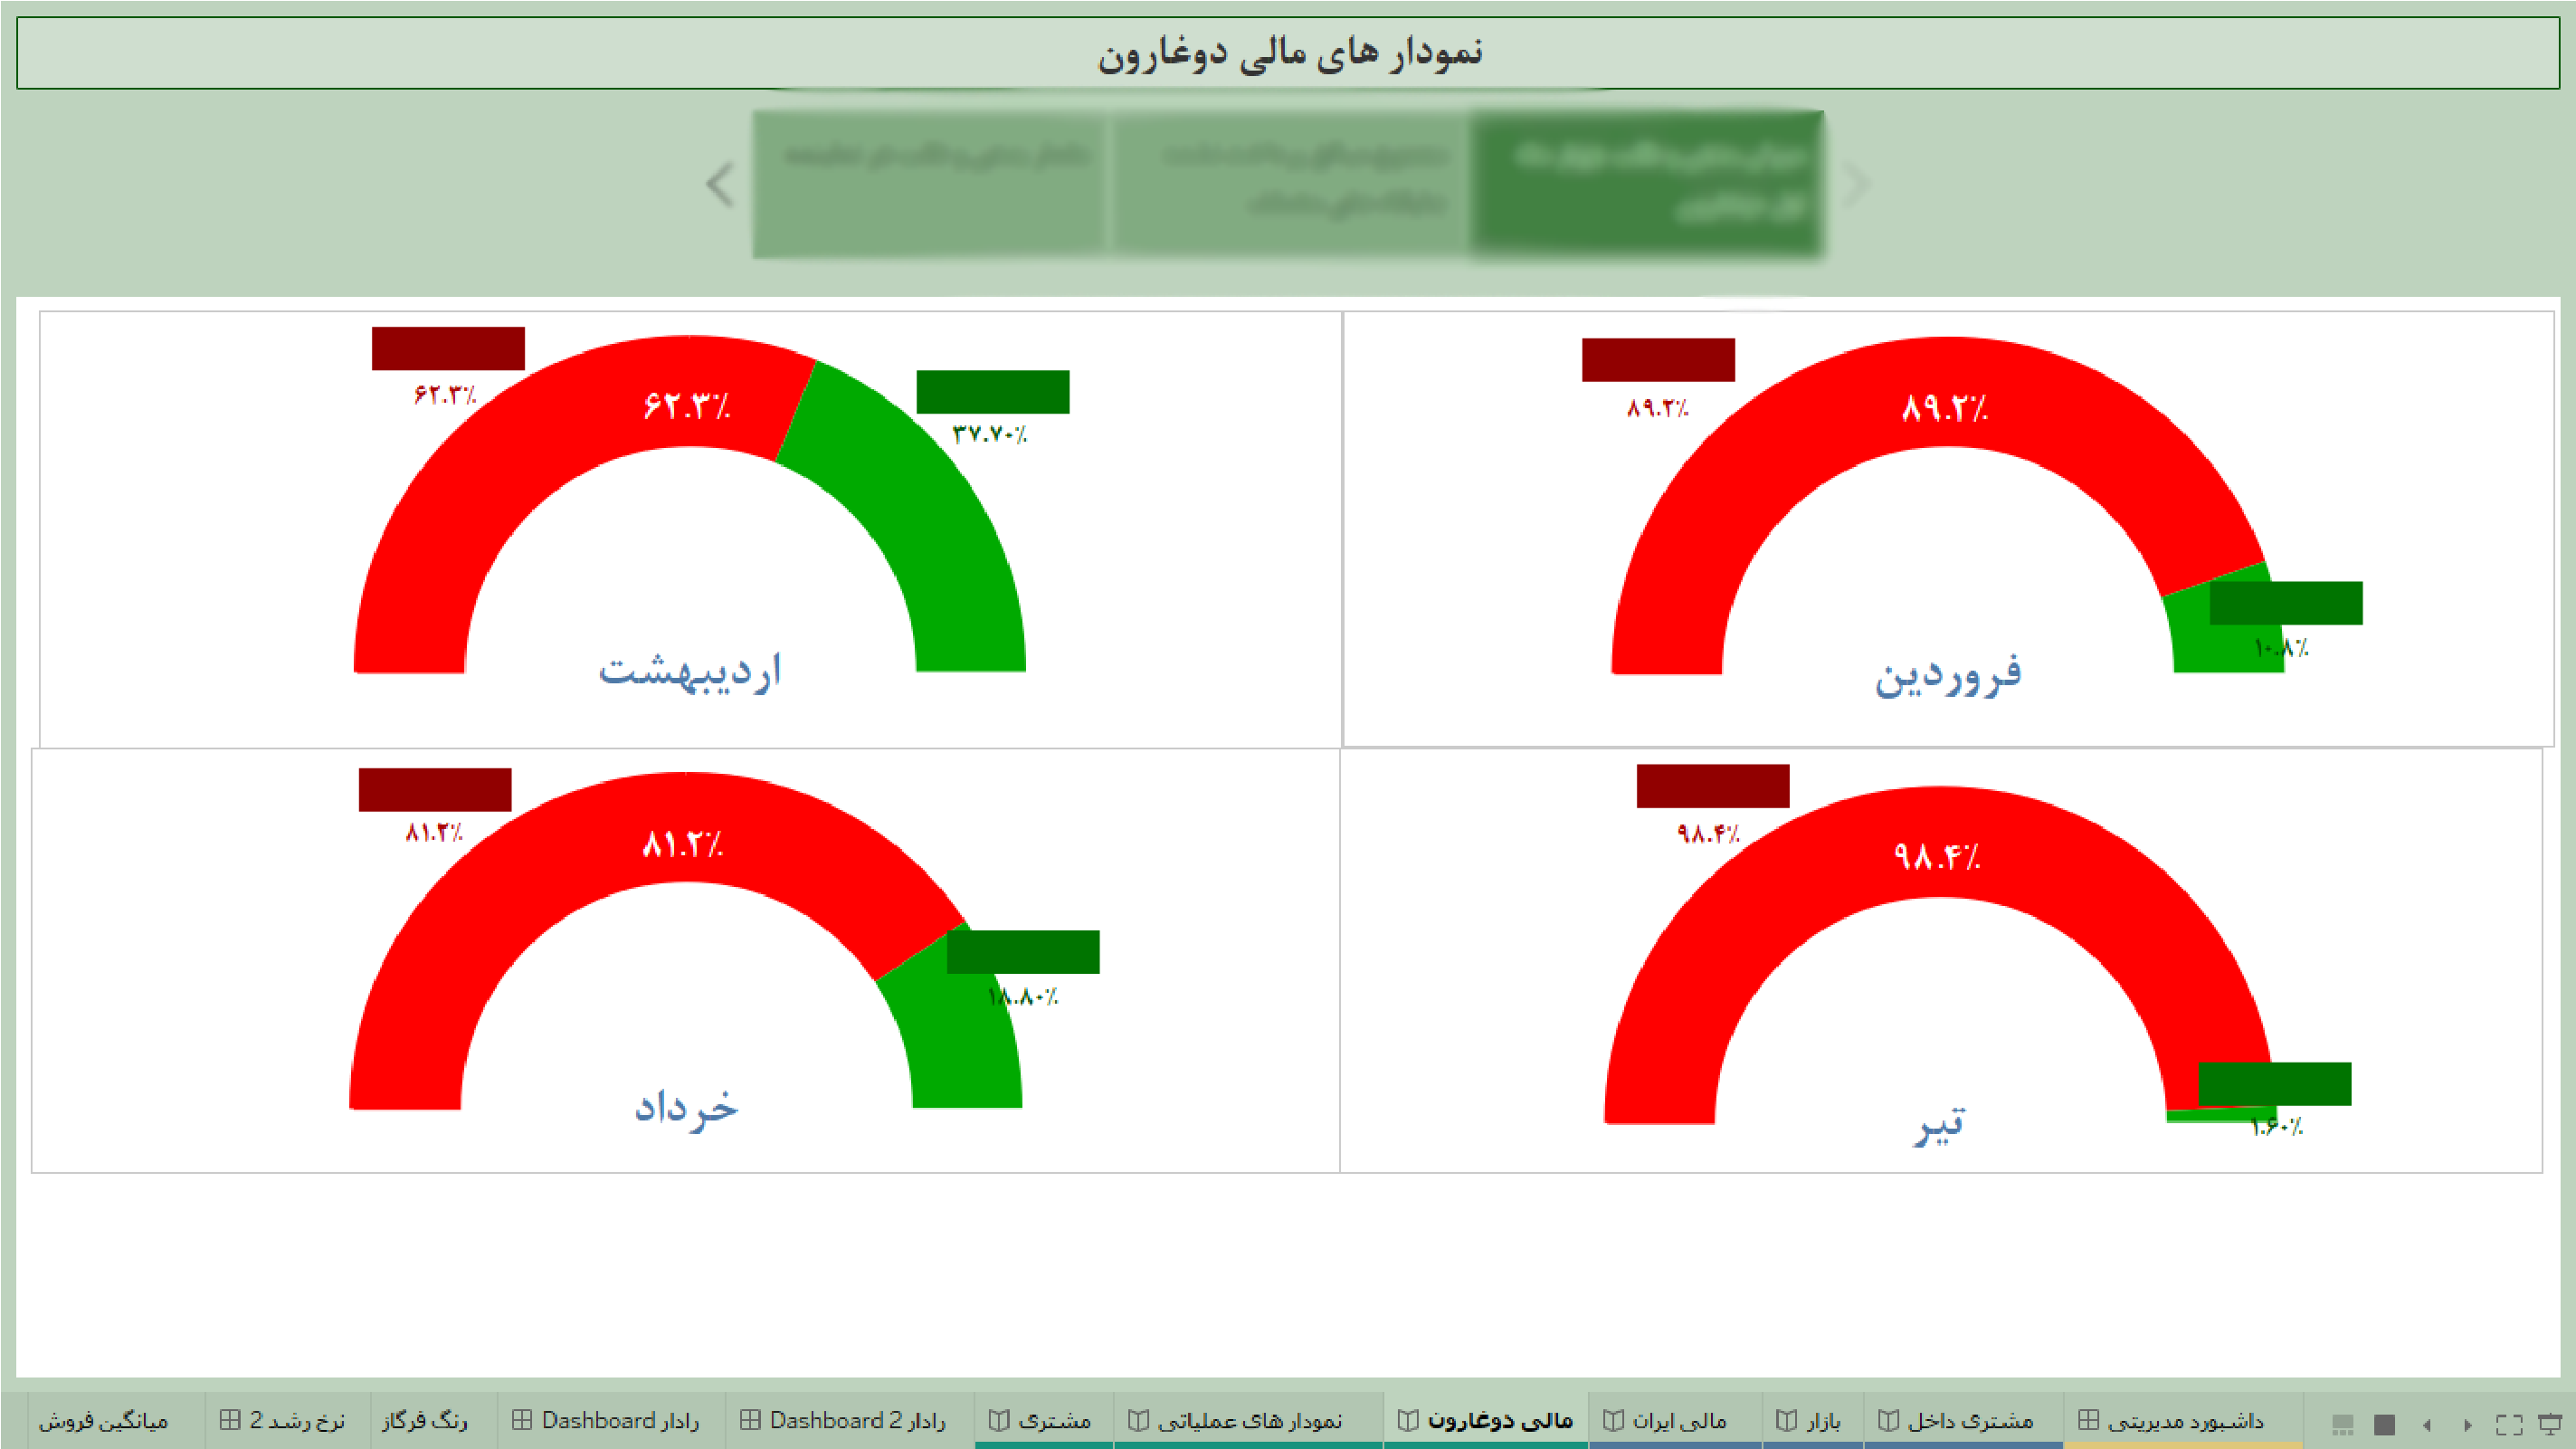
Figure 6. Financial Analysis

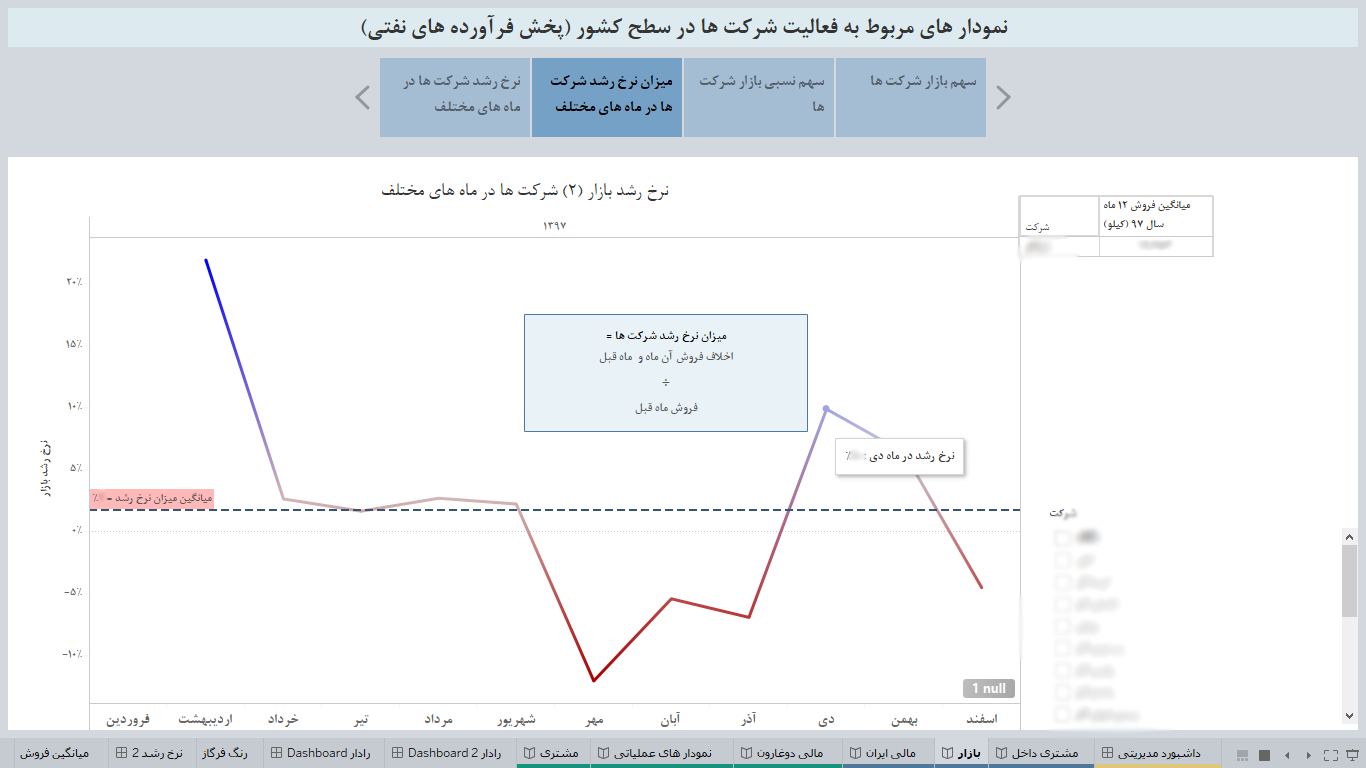
Figure 7. Growth rate of a competitor company


Contact

Feel free to reach out and contact me for any type of research collaboration or freelance project or even for suggestions on my online content :)

My email: mitra.mirshafiee@gmail.com

Other social media: